Performance and scaling
Strong scaling of GUST: CPU runs on 1 to 64 MPI ranks of a Kestrel CPU node (104 Intel Xeon Sapphire Rapids cores), and GPU runs on 1, 2 and 4 GPUs of a Kestrel GPU node (4 × NVIDIA H100); one rank per GPU. GUST 12a81339f on x1002c0s0b0n0, x3109c0s33b0n0.
Set-up
Item |
Value |
|---|---|
Case |
|
Meshes |
32x32x32, 64x64x32, 128x128x32, 256x256x32, 256x256x64, 512x512x64, 512x512x128 |
Boxes |
one per rank: x and y split in powers of 2 ( |
Launch |
CPU |
Timing |
seconds per iteration from the difference of a 10- and a 40-iteration run, using the solver’s stage time ( |
Throughput |
cell-iterations per second (cells / seconds per iteration), in millions (Mcell-it/s); per rank or per GPU, divided by the count |
Minimum cells per rank and per GPU
The smallest load such that every measured point at that load or larger keeps 80 % (50 %) of the best per-rank (per-GPU) throughput. “Levelled off” says whether the best throughput at the largest load is within 5 % of that at the next largest load. If it is still rising, the best throughput is not yet reached and a larger mesh would show it; if it falls, larger loads are slower per cell. The two largest loads can come from meshes of different height (nz), so the test also mixes in the mesh shape.
Device |
Points |
Best Mcell-it/s per rank or GPU |
80 % from (cells) |
50 % from (cells) |
Levelled off |
|---|---|---|---|---|---|
CPU, all rank counts |
31 |
0.381 |
not reached |
not reached |
yes (-3 % at the largest load) |
CPU, 64 ranks (most measured) |
5 |
0.235 |
not reached |
not reached |
no, falls (-28 % at the largest load) |
GPU, 1 GPU |
7 |
82.1 |
16M (16777216) |
2M (2097152) |
no (+6 % at the largest load): add a larger mesh |
GPU, 2 GPUs |
7 |
71.8 |
8M (8388608) |
8M (8388608) |
no (+14 % at the largest load): add a larger mesh |
GPU, 4 GPUs |
7 |
56.4 |
4M (4194304) |
4M (4194304) |
no (+22 % at the largest load): add a larger mesh |
GPU, all GPU counts |
21 |
82.1 |
16M (16777216) |
4M (4194304) |
no (+6 % at the largest load): add a larger mesh |
On the CPU the per-rank throughput depends on two things. It falls as the box per rank grows (less of it fits in cache), and it falls as more ranks share the node’s memory bandwidth. When it falls with load, the largest loads can stay below 80 % (50 %) of the best, and the table then says “not reached”; a larger mesh does not change that. The all-rank-count row mixes both effects; the row with the most ranks is the closest to a full node.
An efficiency above 100 % means the base point (the smallest count measured for that mesh) ran slower per rank than the larger counts, for example a box that does not fit in cache; the per-rank throughput plot shows which.
CPU runs
Mesh |
Cells |
CPU ranks |
Boxes |
Cells per rank |
s per iteration |
Mcell-it/s |
per rank |
Speedup |
Efficiency |
|---|---|---|---|---|---|---|---|---|---|
64x64x32 |
131072 |
1 |
1x1 |
131072 |
0.3442 |
0.381 |
0.381 |
1 |
100 % |
64x64x32 |
131072 |
2 |
2x1 |
65536 |
0.1758 |
0.746 |
0.373 |
1.96 |
98 % |
64x64x32 |
131072 |
4 |
2x2 |
32768 |
0.08843 |
1.48 |
0.371 |
3.89 |
97 % |
64x64x32 |
131072 |
8 |
4x2 |
16384 |
0.04721 |
2.78 |
0.347 |
7.29 |
91 % |
64x64x32 |
131072 |
16 |
4x4 |
8192 |
0.02752 |
4.76 |
0.298 |
12.5 |
78 % |
64x64x32 |
131072 |
32 |
8x4 |
4096 |
0.01941 |
6.75 |
0.211 |
17.7 |
55 % |
64x64x32 |
131072 |
64 |
8x8 |
2048 |
0.01413 |
9.28 |
0.145 |
24.4 |
38 % |
128x128x32 |
524288 |
1 |
1x1 |
524288 |
2.282 |
0.23 |
0.23 |
1 |
100 % |
128x128x32 |
524288 |
2 |
2x1 |
262144 |
0.8602 |
0.609 |
0.305 |
2.65 |
133 % |
128x128x32 |
524288 |
4 |
2x2 |
131072 |
0.4349 |
1.21 |
0.301 |
5.25 |
131 % |
128x128x32 |
524288 |
8 |
4x2 |
65536 |
0.216 |
2.43 |
0.303 |
10.6 |
132 % |
128x128x32 |
524288 |
16 |
4x4 |
32768 |
0.1113 |
4.71 |
0.294 |
20.5 |
128 % |
128x128x32 |
524288 |
32 |
8x4 |
16384 |
0.06416 |
8.17 |
0.255 |
35.6 |
111 % |
128x128x32 |
524288 |
64 |
8x8 |
8192 |
0.03489 |
15 |
0.235 |
65.4 |
102 % |
256x256x32 |
2097152 |
1 |
1x1 |
2097152 |
12.96 |
0.162 |
0.162 |
1 |
100 % |
256x256x32 |
2097152 |
2 |
2x1 |
1048576 |
6.307 |
0.332 |
0.166 |
2.06 |
103 % |
256x256x32 |
2097152 |
4 |
2x2 |
524288 |
2.963 |
0.708 |
0.177 |
4.37 |
109 % |
256x256x32 |
2097152 |
8 |
4x2 |
262144 |
1.516 |
1.38 |
0.173 |
8.55 |
107 % |
256x256x32 |
2097152 |
16 |
4x4 |
131072 |
0.811 |
2.59 |
0.162 |
16 |
100 % |
256x256x32 |
2097152 |
32 |
8x4 |
65536 |
0.4252 |
4.93 |
0.154 |
30.5 |
95 % |
256x256x32 |
2097152 |
64 |
8x8 |
32768 |
0.1514 |
13.8 |
0.216 |
85.6 |
134 % |
256x256x64 |
4194304 |
2 |
2x1 |
2097152 |
18.54 |
0.226 |
0.113 |
2 |
100 % |
256x256x64 |
4194304 |
4 |
2x2 |
1048576 |
9.256 |
0.453 |
0.113 |
4.01 |
100 % |
256x256x64 |
4194304 |
8 |
4x2 |
524288 |
3.617 |
1.16 |
0.145 |
10.3 |
128 % |
256x256x64 |
4194304 |
16 |
4x4 |
262144 |
1.969 |
2.13 |
0.133 |
18.8 |
118 % |
256x256x64 |
4194304 |
32 |
8x4 |
131072 |
0.9872 |
4.25 |
0.133 |
37.6 |
117 % |
256x256x64 |
4194304 |
64 |
8x8 |
65536 |
0.4966 |
8.45 |
0.132 |
74.7 |
117 % |
512x512x64 |
16777216 |
8 |
4x2 |
2097152 |
22.17 |
0.757 |
0.0946 |
8 |
100 % |
512x512x64 |
16777216 |
16 |
4x4 |
1048576 |
13.42 |
1.25 |
0.0781 |
13.2 |
83 % |
512x512x64 |
16777216 |
32 |
8x4 |
524288 |
6.142 |
2.73 |
0.0854 |
28.9 |
90 % |
512x512x64 |
16777216 |
64 |
8x8 |
262144 |
2.757 |
6.09 |
0.0951 |
64.3 |
101 % |
Speedup and efficiency against the smallest CPU rank count measured for each mesh.
GPU runs
Mesh |
Cells |
GPUs |
Boxes |
Cells per GPU |
s per iteration |
Mcell-it/s |
per GPU |
Speedup |
Efficiency |
|---|---|---|---|---|---|---|---|---|---|
32x32x32 |
32768 |
1 |
1x1 |
32768 |
0.01871 |
1.75 |
1.75 |
1 |
100 % |
32x32x32 |
32768 |
2 |
2x1 |
16384 |
0.02651 |
1.24 |
0.618 |
0.706 |
35 % |
32x32x32 |
32768 |
4 |
2x2 |
8192 |
0.0288 |
1.14 |
0.284 |
0.65 |
16 % |
64x64x32 |
131072 |
1 |
1x1 |
131072 |
0.02122 |
6.18 |
6.18 |
1 |
100 % |
64x64x32 |
131072 |
2 |
2x1 |
65536 |
0.02834 |
4.62 |
2.31 |
0.749 |
37 % |
64x64x32 |
131072 |
4 |
2x2 |
32768 |
0.03098 |
4.23 |
1.06 |
0.685 |
17 % |
128x128x32 |
524288 |
1 |
1x1 |
524288 |
0.02804 |
18.7 |
18.7 |
1 |
100 % |
128x128x32 |
524288 |
2 |
2x1 |
262144 |
0.03253 |
16.1 |
8.06 |
0.862 |
43 % |
128x128x32 |
524288 |
4 |
2x2 |
131072 |
0.0344 |
15.2 |
3.81 |
0.815 |
20 % |
256x256x32 |
2097152 |
1 |
1x1 |
2097152 |
0.04553 |
46.1 |
46.1 |
1 |
100 % |
256x256x32 |
2097152 |
2 |
2x1 |
1048576 |
0.04444 |
47.2 |
23.6 |
1.02 |
51 % |
256x256x32 |
2097152 |
4 |
2x2 |
524288 |
0.04249 |
49.4 |
12.3 |
1.07 |
27 % |
256x256x64 |
4194304 |
1 |
1x1 |
4194304 |
0.07317 |
57.3 |
57.3 |
1 |
100 % |
256x256x64 |
4194304 |
2 |
2x1 |
2097152 |
0.06288 |
66.7 |
33.4 |
1.16 |
58 % |
256x256x64 |
4194304 |
4 |
2x2 |
1048576 |
0.05614 |
74.7 |
18.7 |
1.3 |
33 % |
512x512x64 |
16777216 |
1 |
1x1 |
16777216 |
0.2162 |
77.6 |
77.6 |
1 |
100 % |
512x512x64 |
16777216 |
2 |
2x1 |
8388608 |
0.1329 |
126 |
63.1 |
1.63 |
81 % |
512x512x64 |
16777216 |
4 |
2x2 |
4194304 |
0.09058 |
185 |
46.3 |
2.39 |
60 % |
512x512x128 |
33554432 |
1 |
1x1 |
33554432 |
0.4087 |
82.1 |
82.1 |
1 |
100 % |
512x512x128 |
33554432 |
2 |
2x1 |
16777216 |
0.2336 |
144 |
71.8 |
1.75 |
87 % |
512x512x128 |
33554432 |
4 |
2x2 |
8388608 |
0.1488 |
226 |
56.4 |
2.75 |
69 % |
Speedup and efficiency against the smallest GPU count measured for each mesh.
Plots
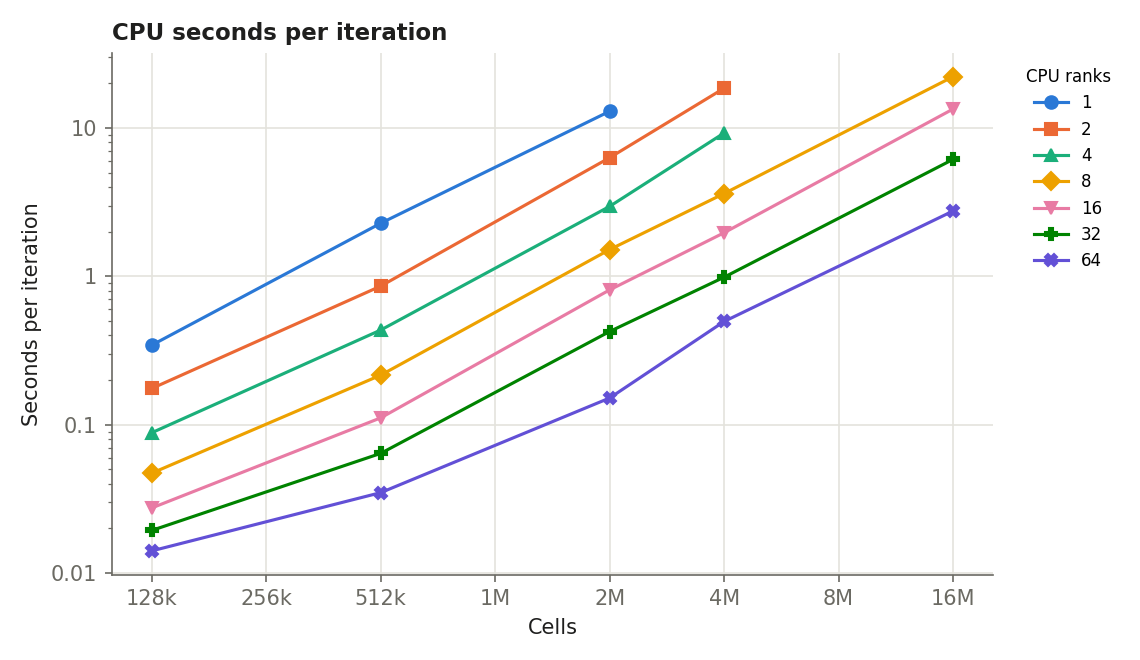
Fig. 7 CPU seconds per iteration against mesh size, one line per rank count.
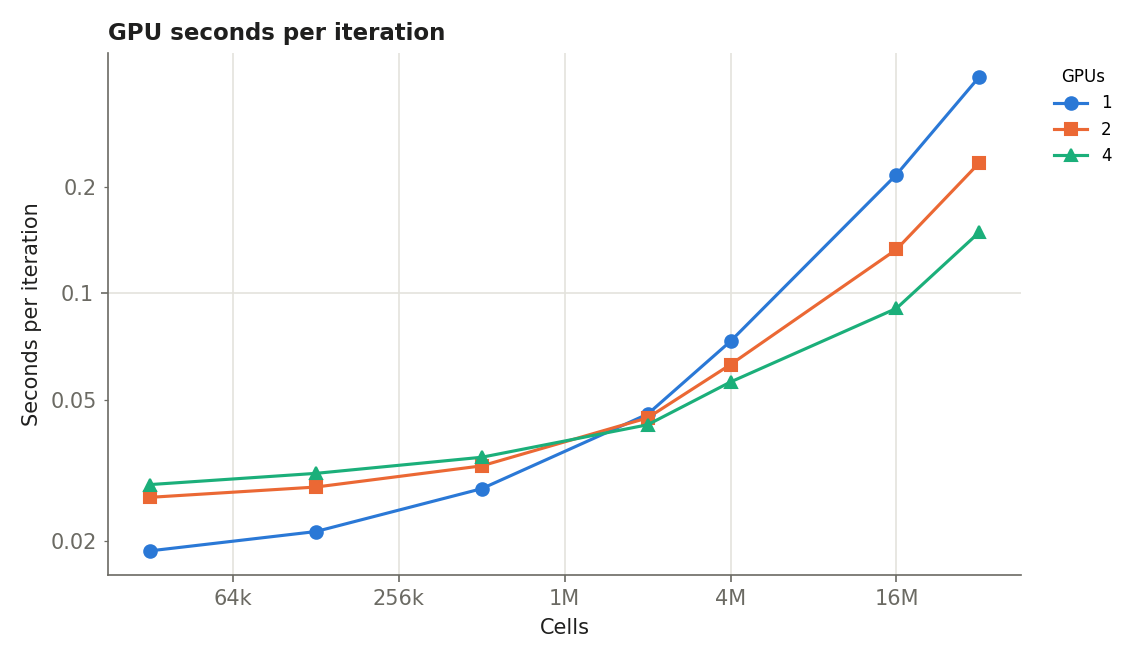
Fig. 8 GPU seconds per iteration against mesh size, one line per GPU count.
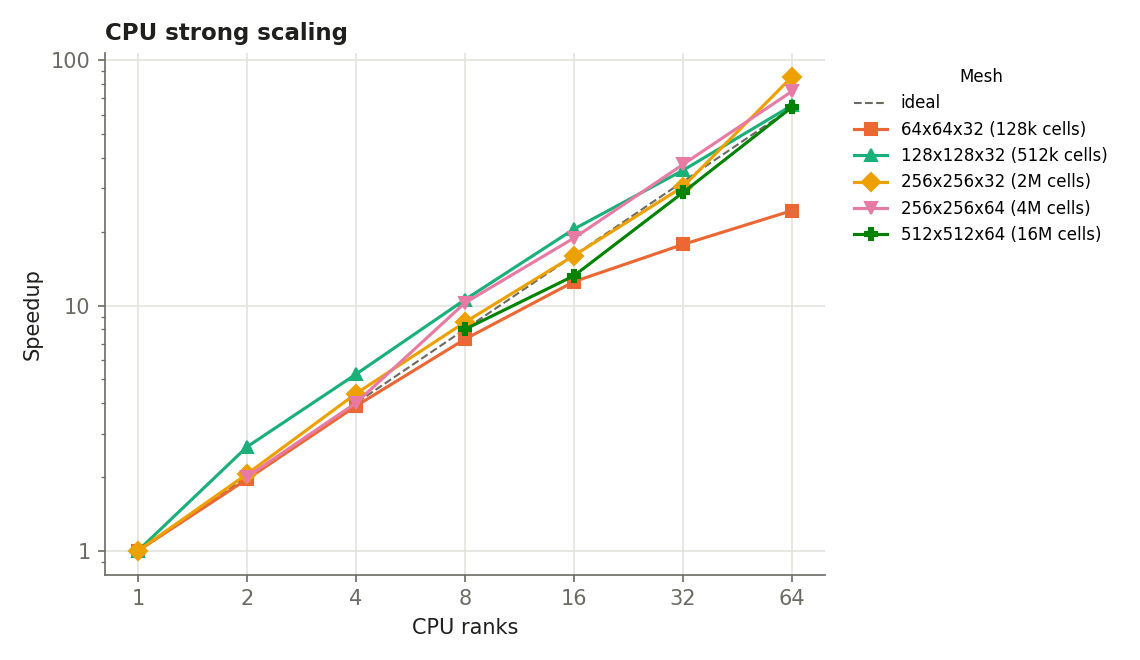
Fig. 9 CPU strong scaling: speedup against the smallest rank count of each mesh.
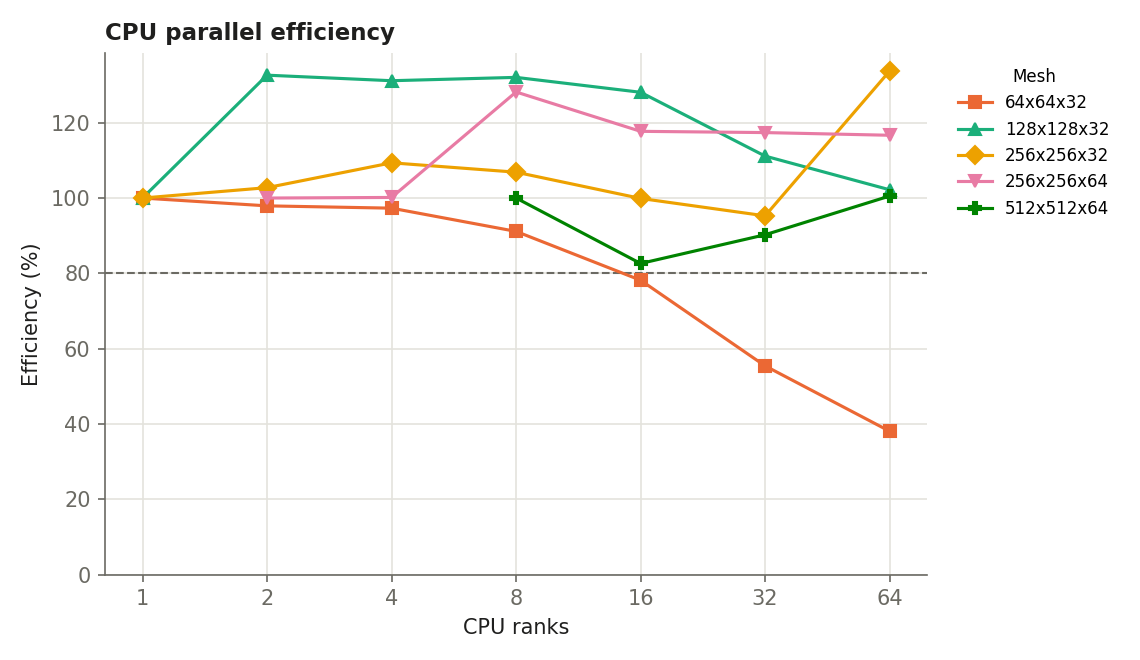
Fig. 10 CPU parallel efficiency.
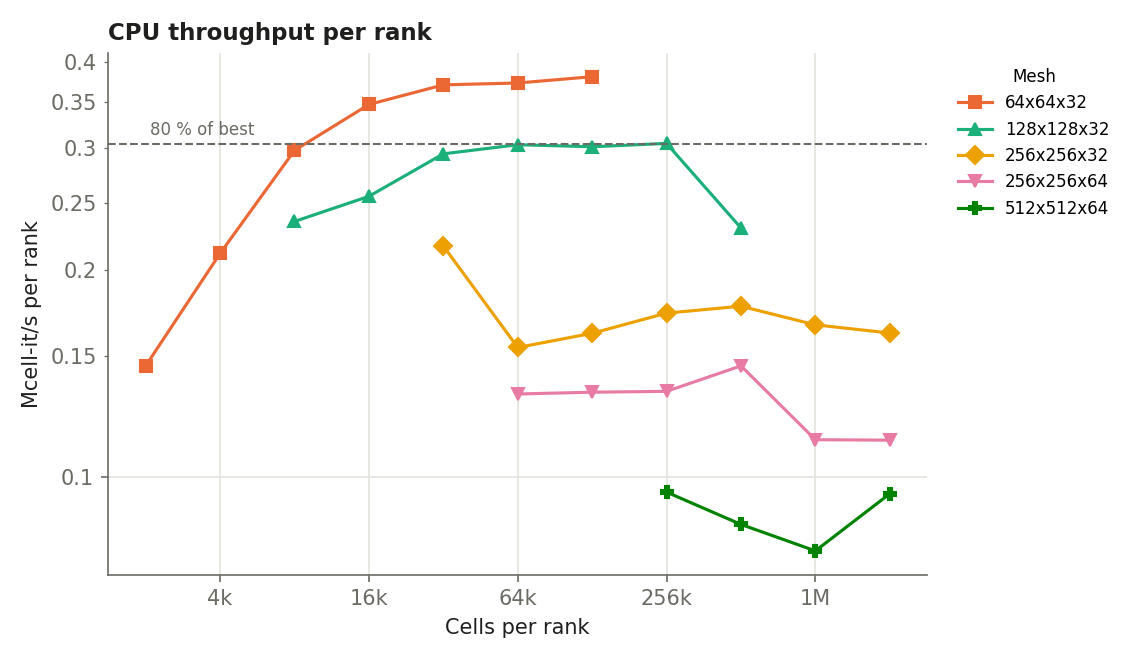
Fig. 11 CPU throughput per rank against cells per rank.
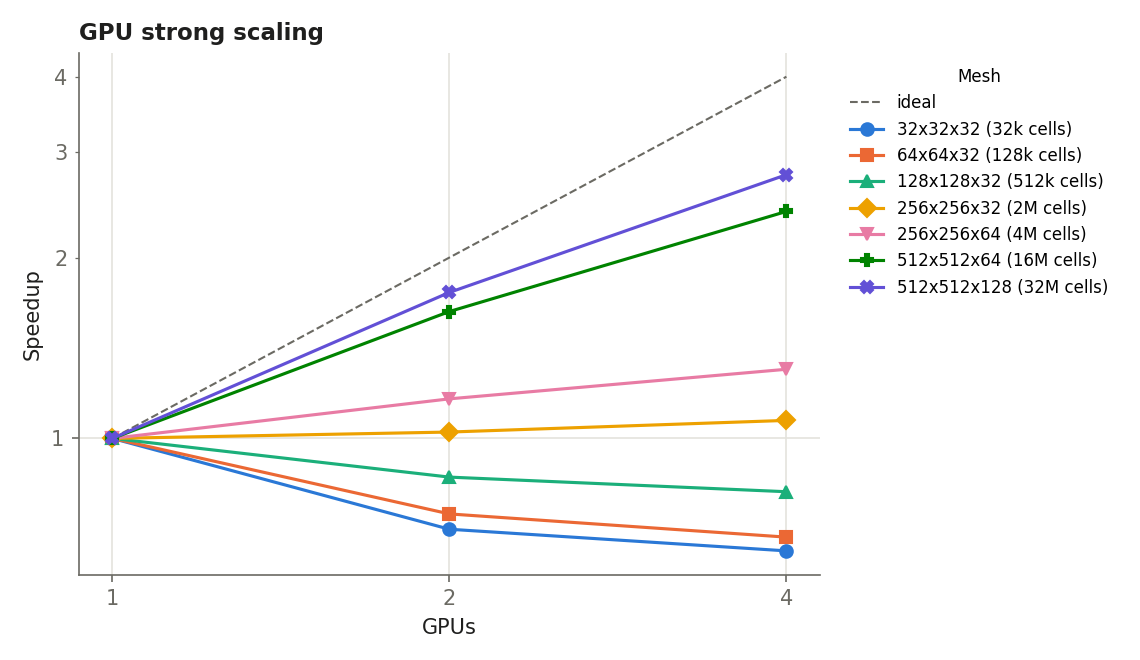
Fig. 12 GPU strong scaling: speedup against the smallest GPU count of each mesh.
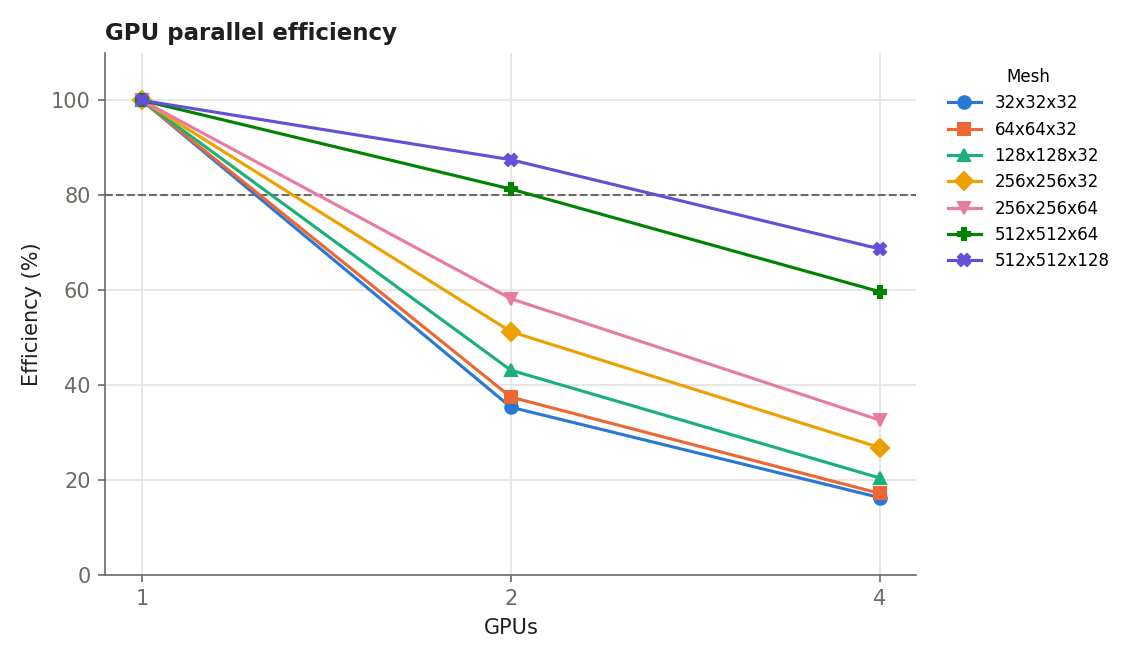
Fig. 13 GPU parallel efficiency.
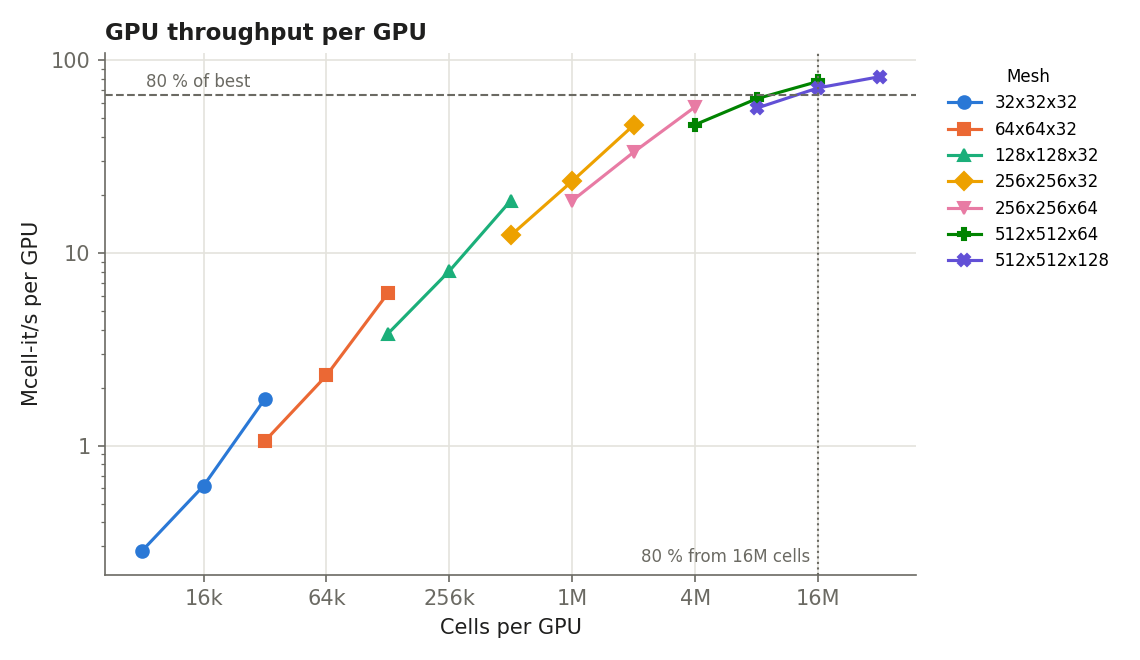
Fig. 14 GPU throughput per GPU against cells per GPU.
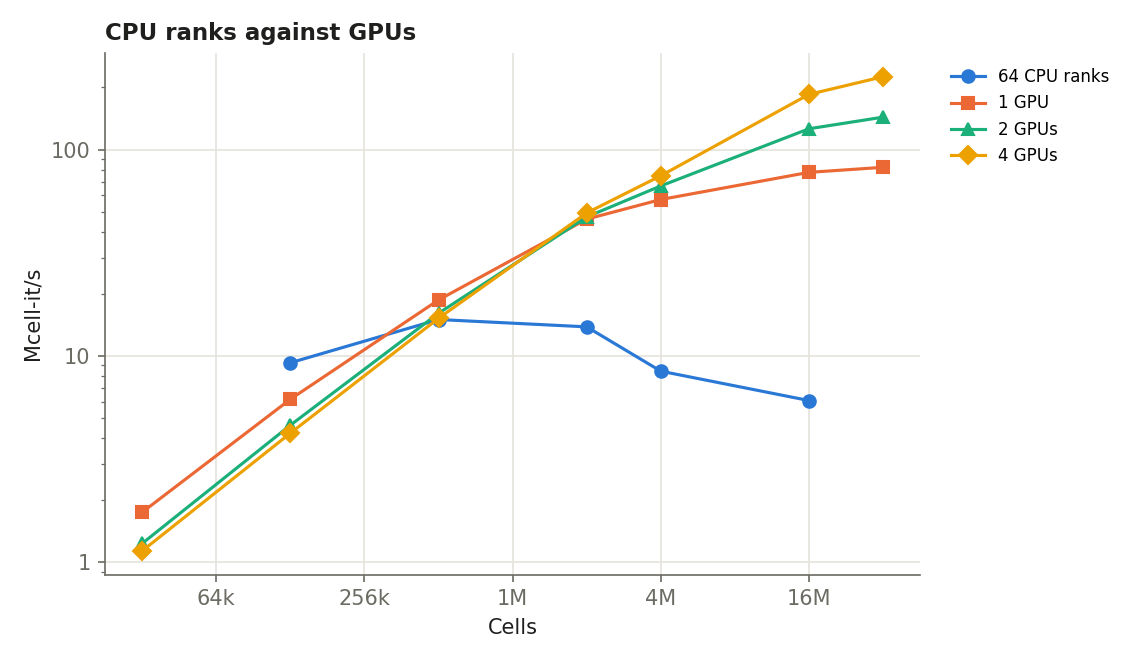
Fig. 15 Total throughput: the most CPU ranks measured against each GPU count.
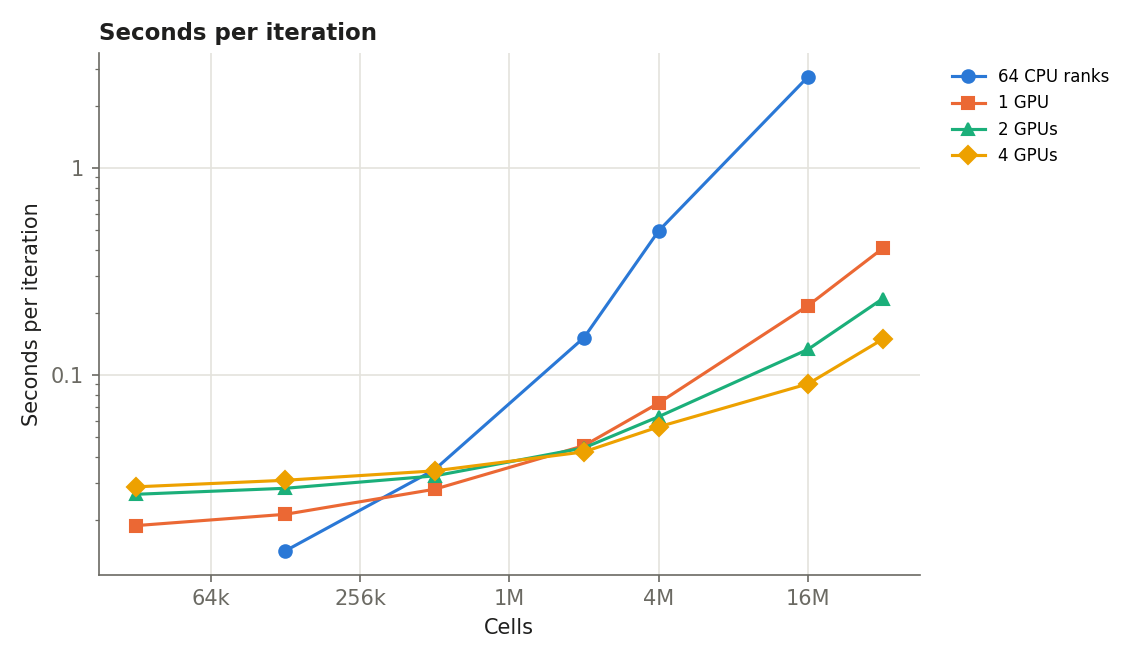
Fig. 16 Seconds per iteration against mesh size: the most CPU ranks measured and each GPU count.
Reproducing
run_scaling.sh (in a one-node allocation; CPU_TARGET=spr on a CPU node) builds GUST for CPU and CUDA, runs every point and writes results.csv; analyze_scaling.py results.csv writes the plots into --out and this page and the README section (scaling.rst, readme_scaling.md) next to results.csv; copy the plots to docs/figures/scaling/, the page to docs/ and the section into README.md. Finished points are skipped when run_scaling.sh runs again. The measured results.csv and analyze_scaling.py are in tools/scaling/; run_scaling.sh is not in the repository yet.